Shipping Rate Analysis Drives 74% Increase in Purchase Rate for eBay Model Train Retailer
Request a Free Discovery CallSnapshot
74%
Purchase rate increase
32%
Profit increase
47.6%
Gross margin
Running on Instinct, Not Data
The Dog & Caboose built its reputation on one thing: being straight with customers. Fair prices, transparent practices, free tools on their website. But without real-time visibility into their own numbers, they were running on instinct and a spreadsheet updated once a week, if that.
A suspicion had been quietly growing for months. Customers were likely paying more for shipping than they actually should. For a brand whose identity is built on honesty, that wasn't just a pricing inefficiency. It was a values problem.
A Complete Data Infrastructure from Scratch
Pemberton Data Solutions built a complete data infrastructure from scratch. A full Azure pipeline pulls live data directly from the eBay Selling API into an Azure SQL database, where it's cleaned, structured, and joined with external operating costs including shipping supplies, storage, and tools tracked in a separate internal sheet. That feeds a three-page Power BI report covering sales performance, inventory health, and a complete financial P&L. It refreshes automatically every day.
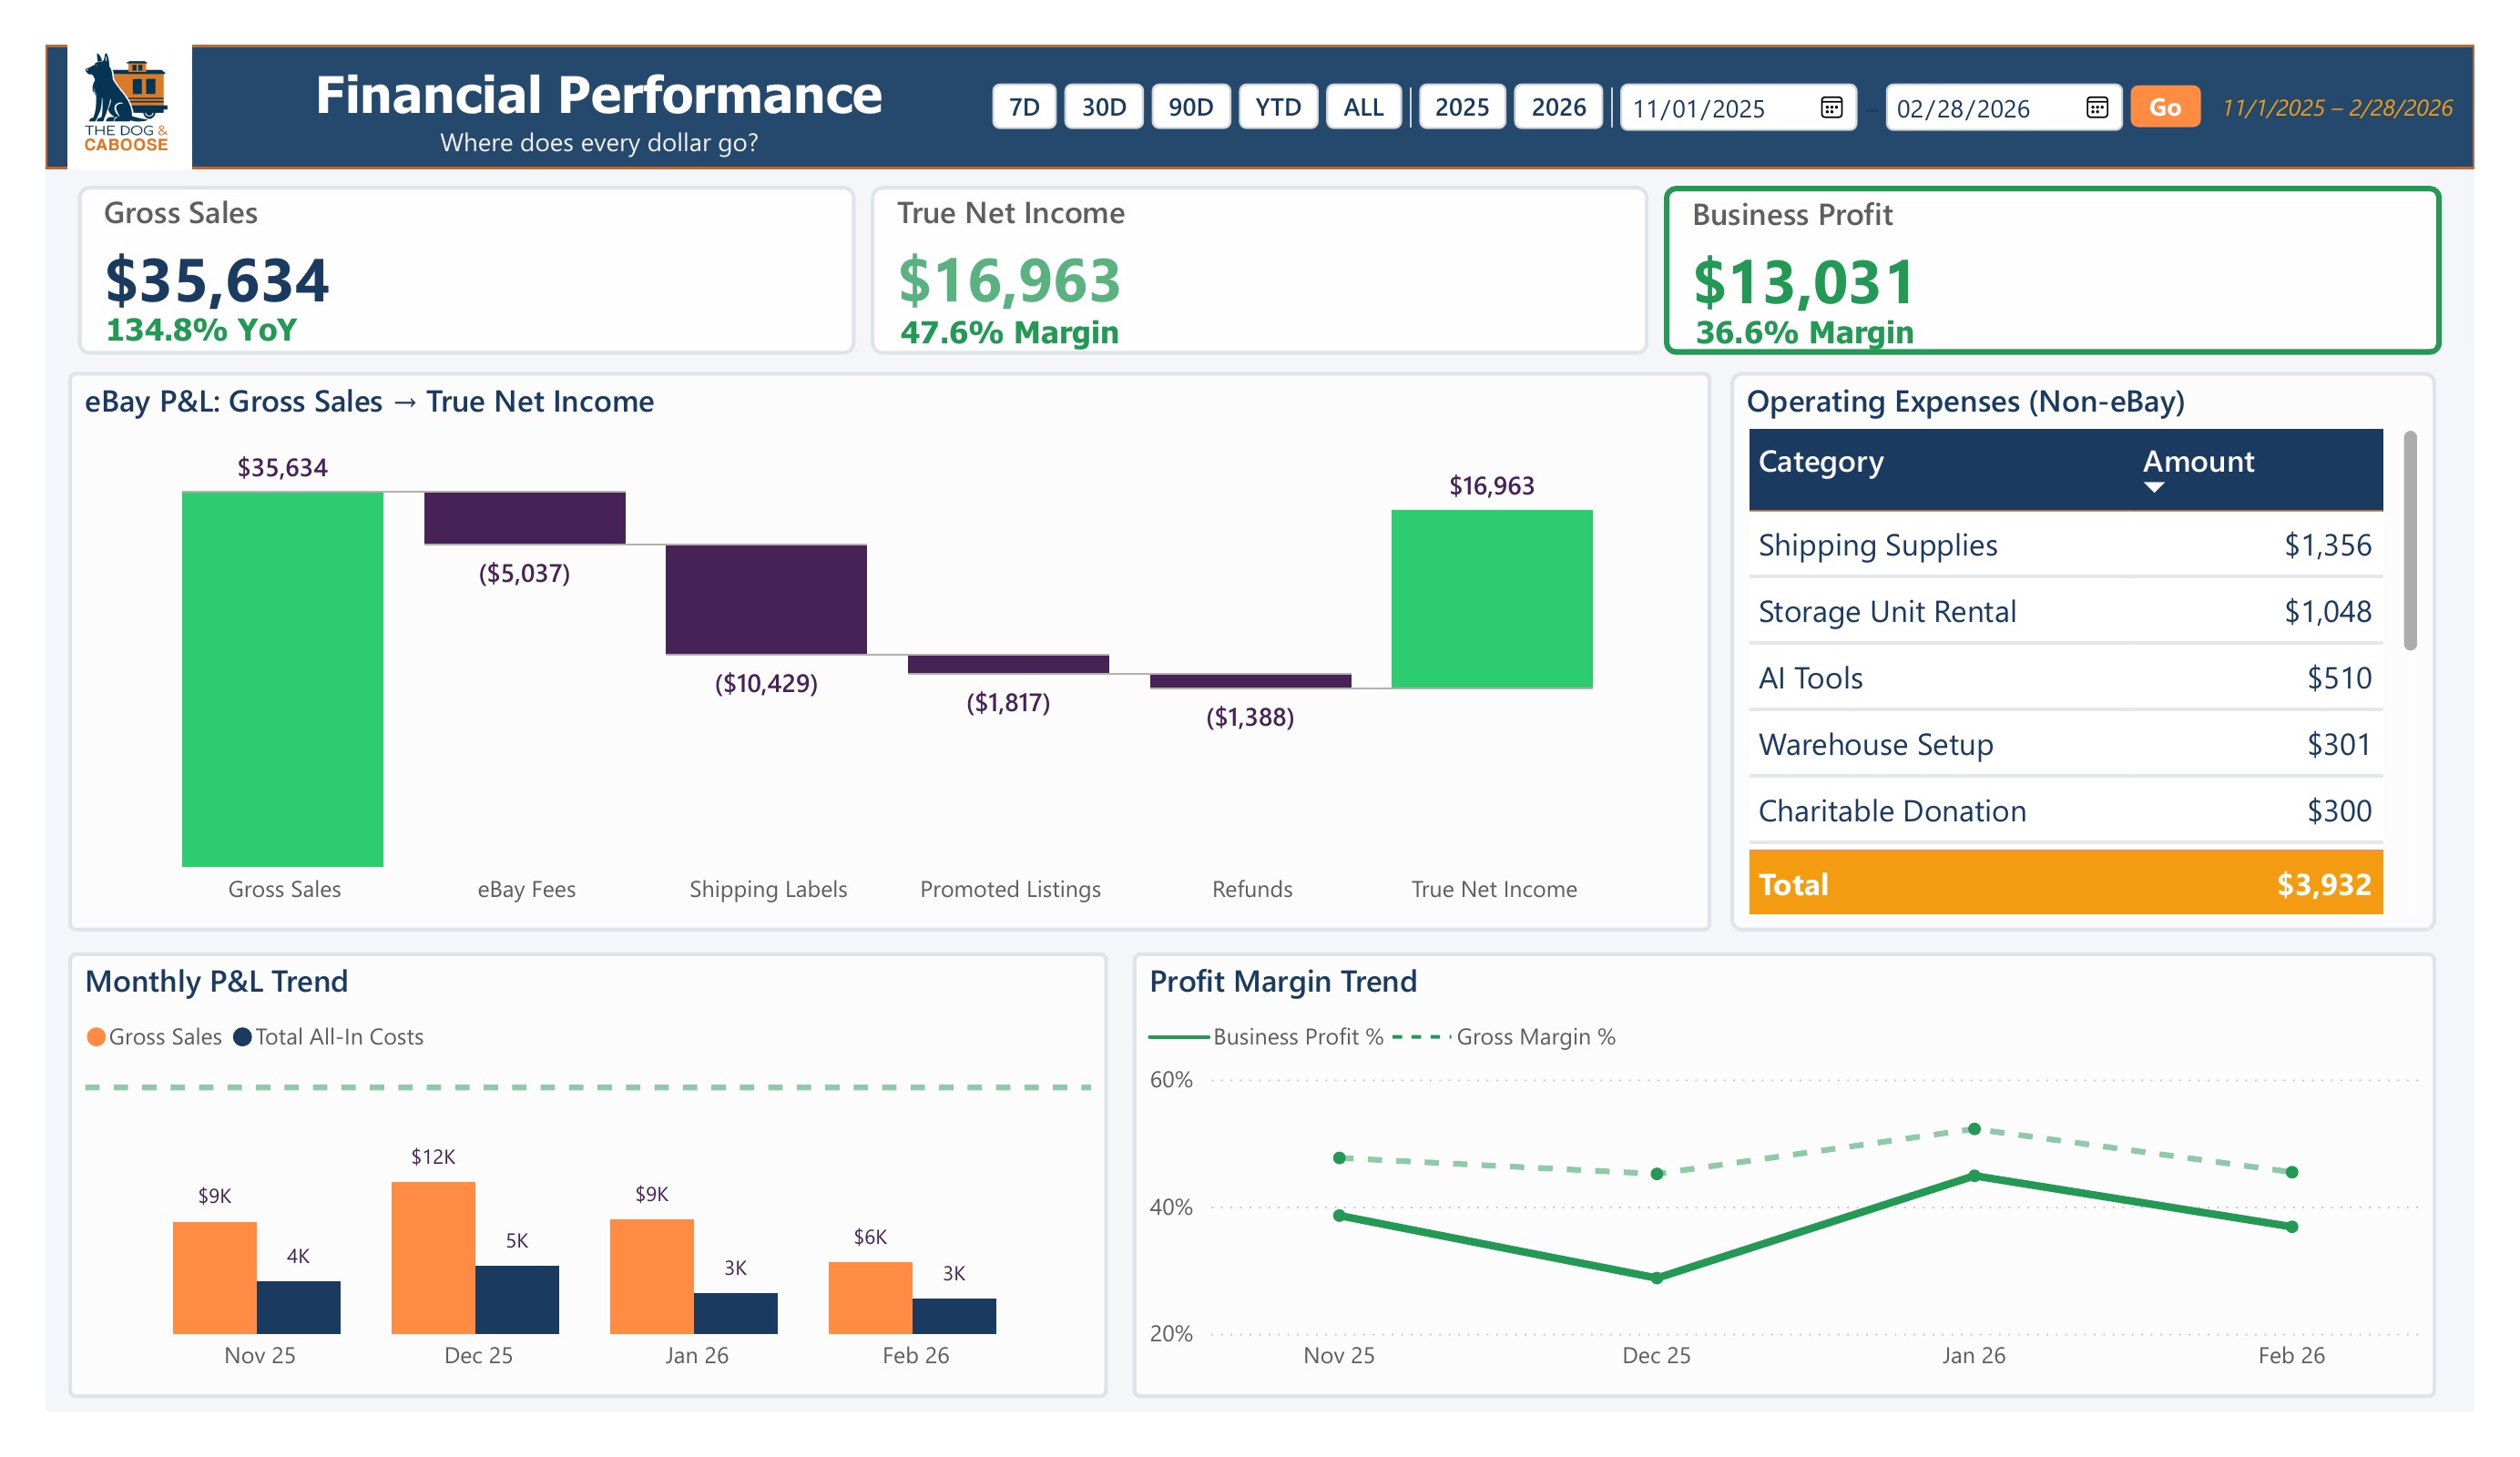
The Data Confirmed the Suspicion
The data confirmed what ownership suspected.
72% of customers were overpaying on shipping
42% of them were paying more than $1.25 above actual carrier cost per order.
The culprit was the large parcel rate tier. Customers were being charged $9.99 for shipments that cost $7.89 to send. This wasn't a minor rounding issue either. Shipping labels were costing the business $10,429 over the period studied, nearly three times eBay's own platform fees of $5,037. Shipping was the single largest cost in the entire P&L, which made accuracy here matter more than anywhere else.
(74% purchase rate increase and 32% profit increase figures are derived from internal sales records.)
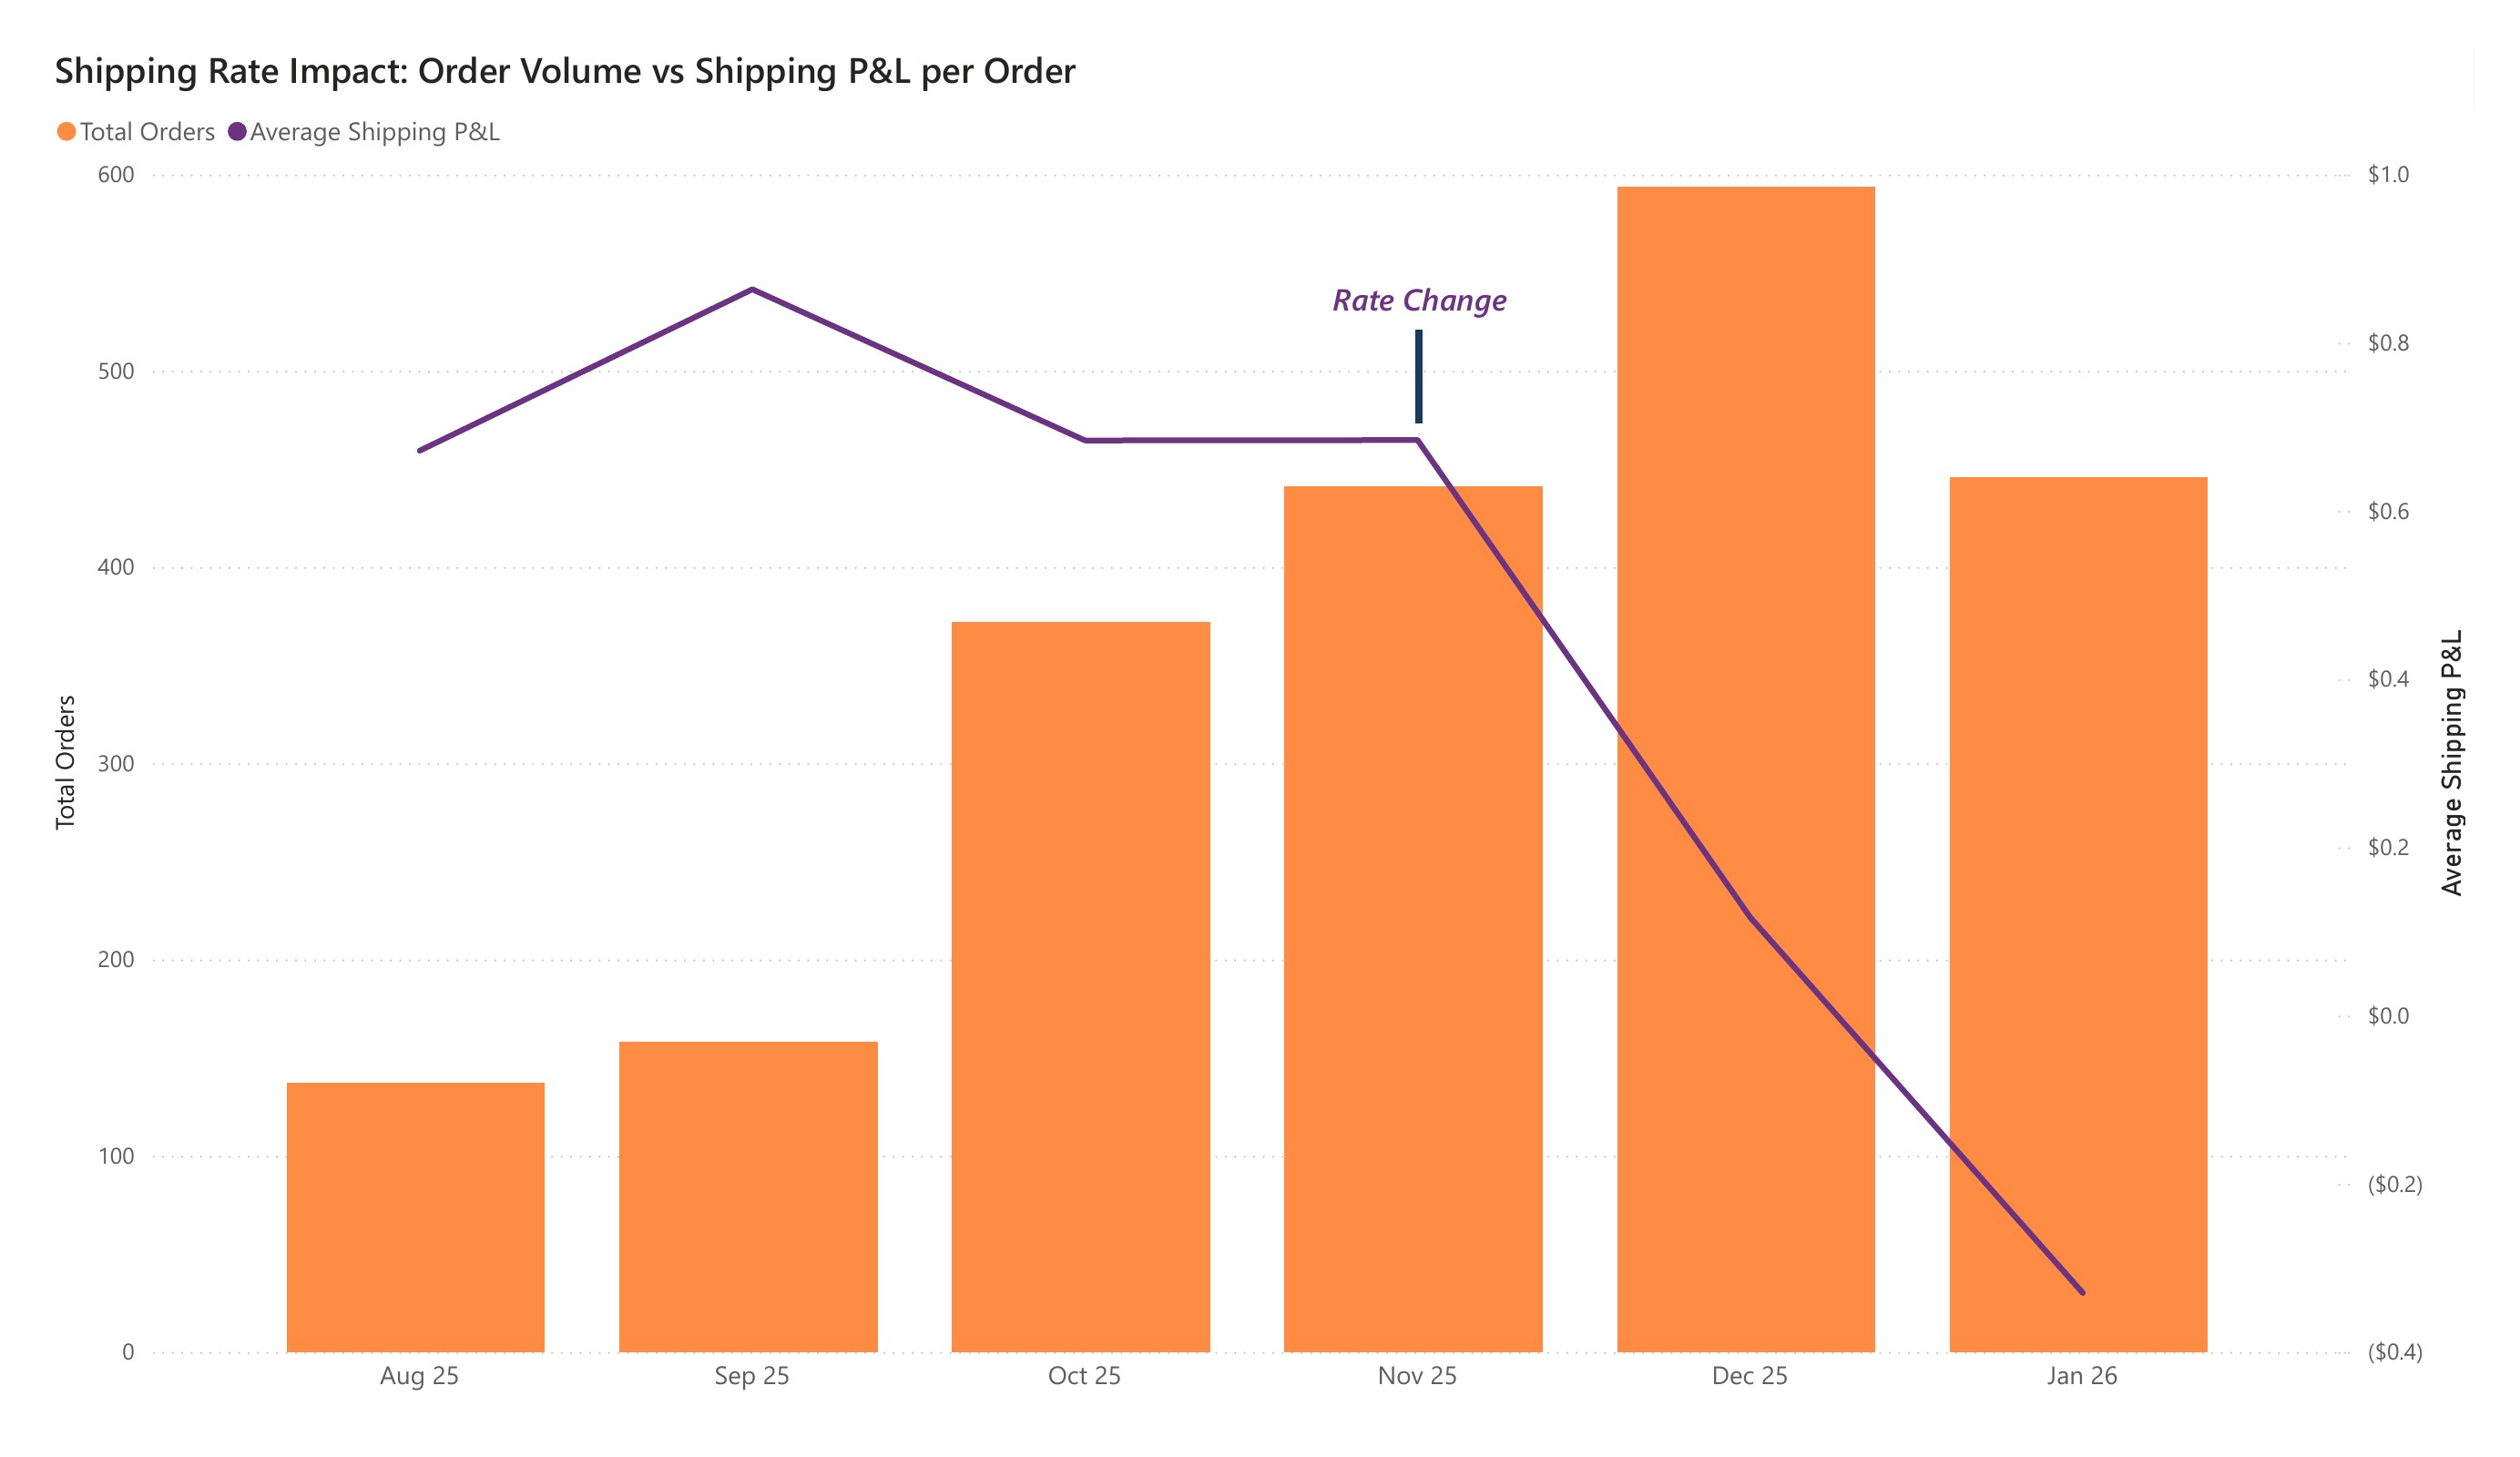
Targeted Rate Corrections
The shipping rate tables were pulled apart region by region. The large tier, the primary offender, was reduced from $9.99 to $8.49 in the most affected regions. That covers actual carrier cost plus a modest allowance for boxes and handling. Nothing more.
The Goal Was Fairness. What Happened Was Unexpected.
The goal was never to make more money. The goal was to stop overcharging customers. What happened after the adjustment was unexpected.
74%
Purchase Rate Increase
32%
Profit Increase
47.6%
Gross Margin
+
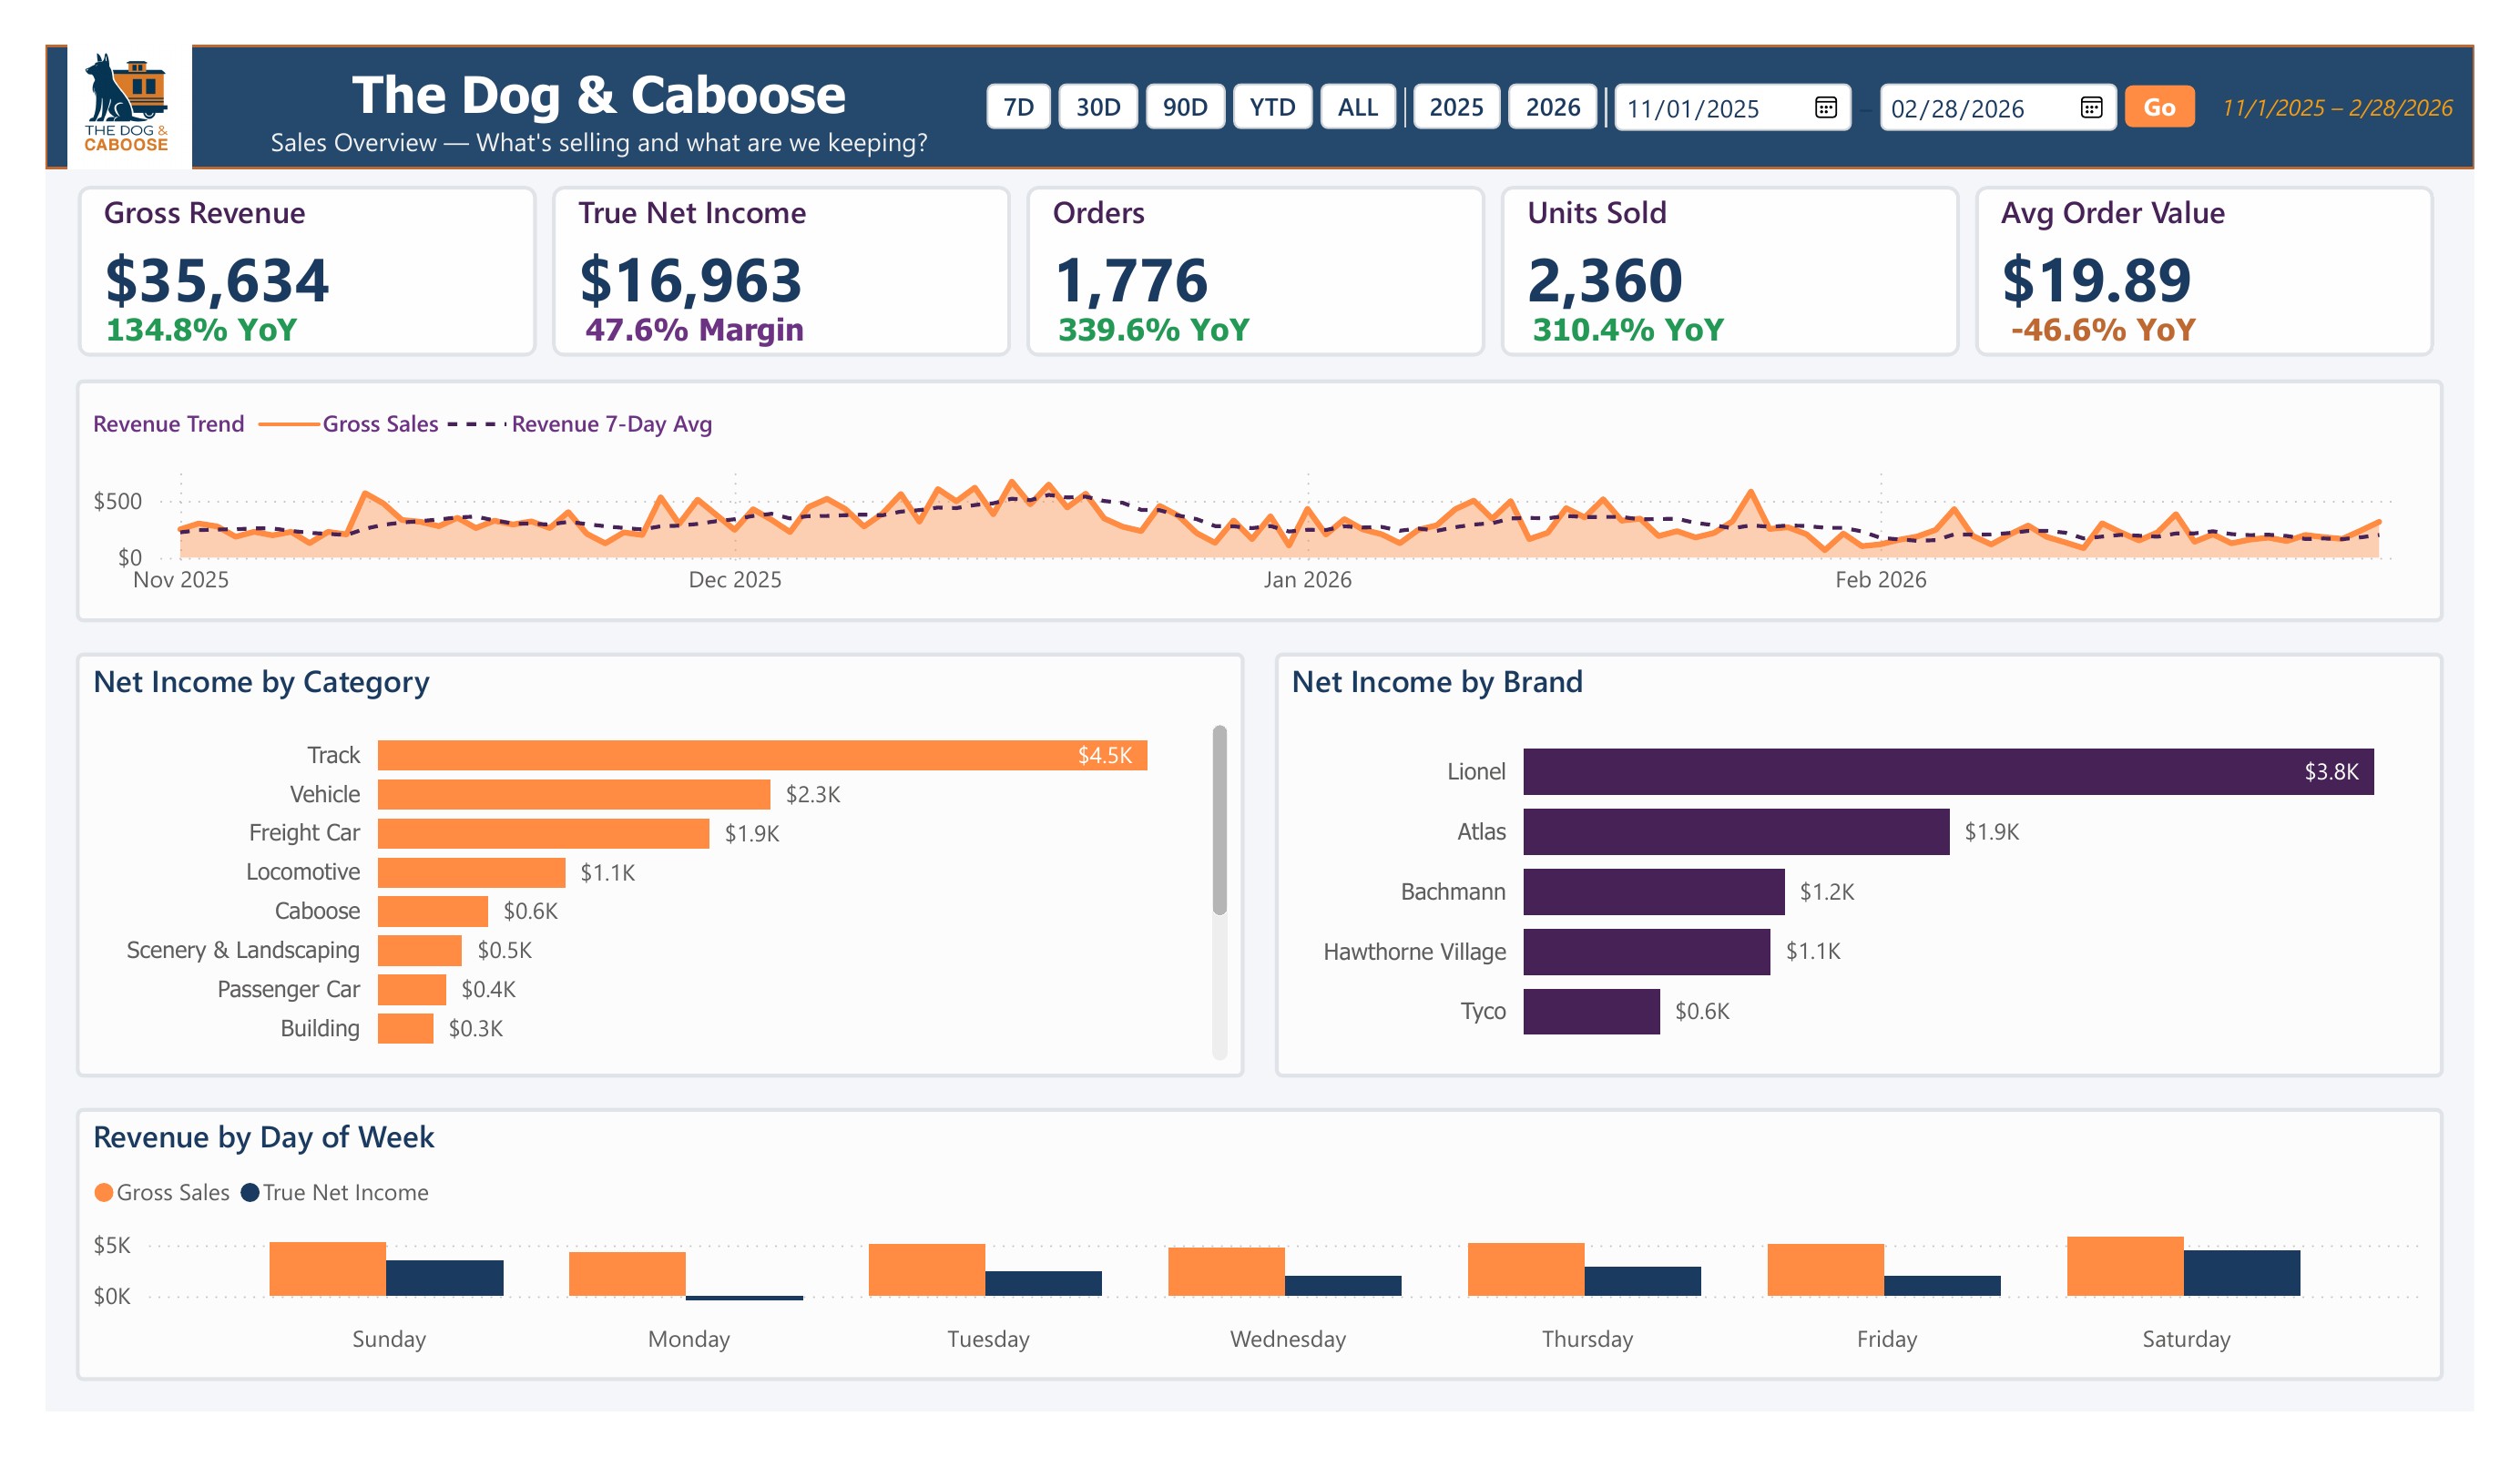
Smaller Items Moving Again
Smaller items, previously made uncompetitive by oversized shipping costs, started moving again. Gross margin reached 47.6% for the Nov 2025 through Feb 2026 period. All figures from internal sales records.
The Infrastructure Now Runs the Business
The infrastructure built to find the shipping problem now runs the entire business. Shipping rates are monitored continuously against USPS and UPS schedule changes. Sales data flows in automatically every morning.
The category P&L breakdown surfaced something ownership hadn't expected: a product category they had always treated as low-value filler was generating more net income than any other category at $4,500 for the period. That single finding reshaped their sourcing strategy entirely.
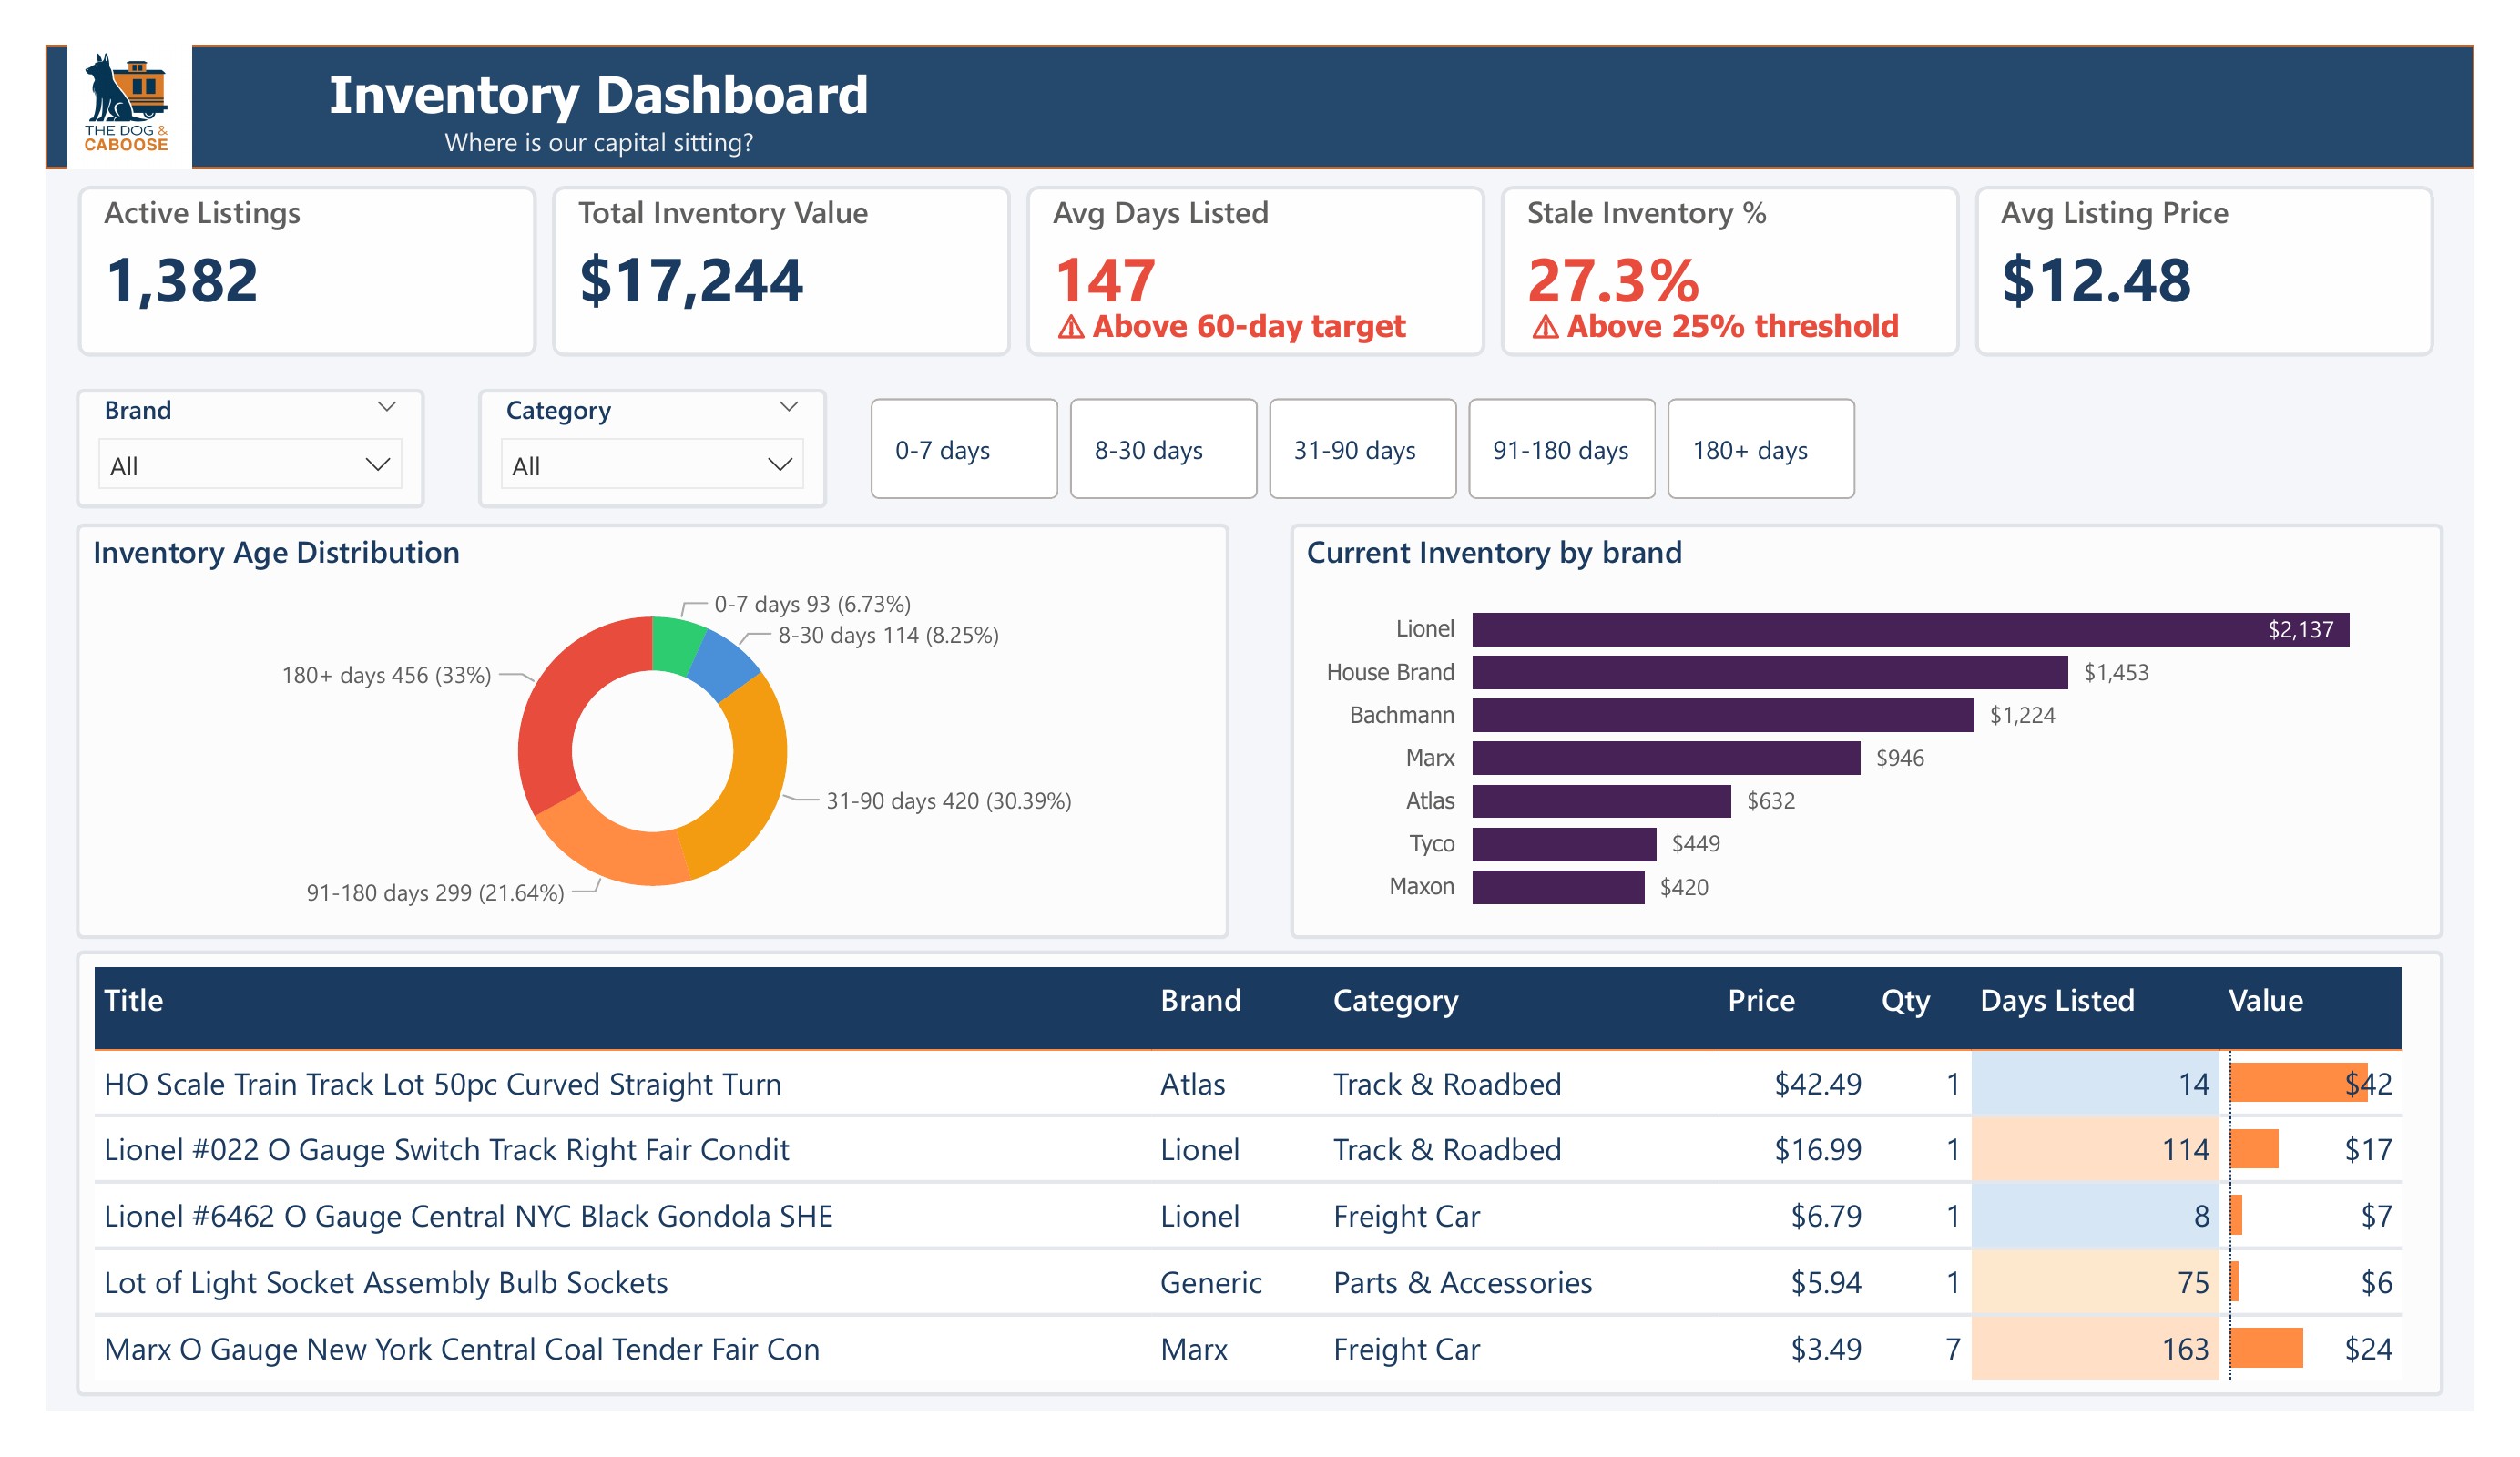
456 listings are currently sitting past 180 days, representing 33% of active inventory. That's the next problem the dashboard is being used to solve.
Tax reporting this year was completed directly from the centralized data for the first time. No manual reconciliation, no hunting across spreadsheets.
The Power BI Report Built for This Business
A three-page report covering sales performance, inventory health, and a complete financial P&L — plus a dedicated shipping rate impact analysis. All powered by a live Azure data pipeline refreshing daily from the eBay Selling API.
Curious What Your Data Might Be Telling You?
Request a Free Discovery Call → pembertondata.com
Request a Free Discovery CallFinancial figures shown have been anonymized.