Building the Greenville Development Explorer
See the Live Map →Snapshot
100%
Residential records masked
2
Pipeline triggers
3
Data problems solved
A Map Built from the City's Own Data
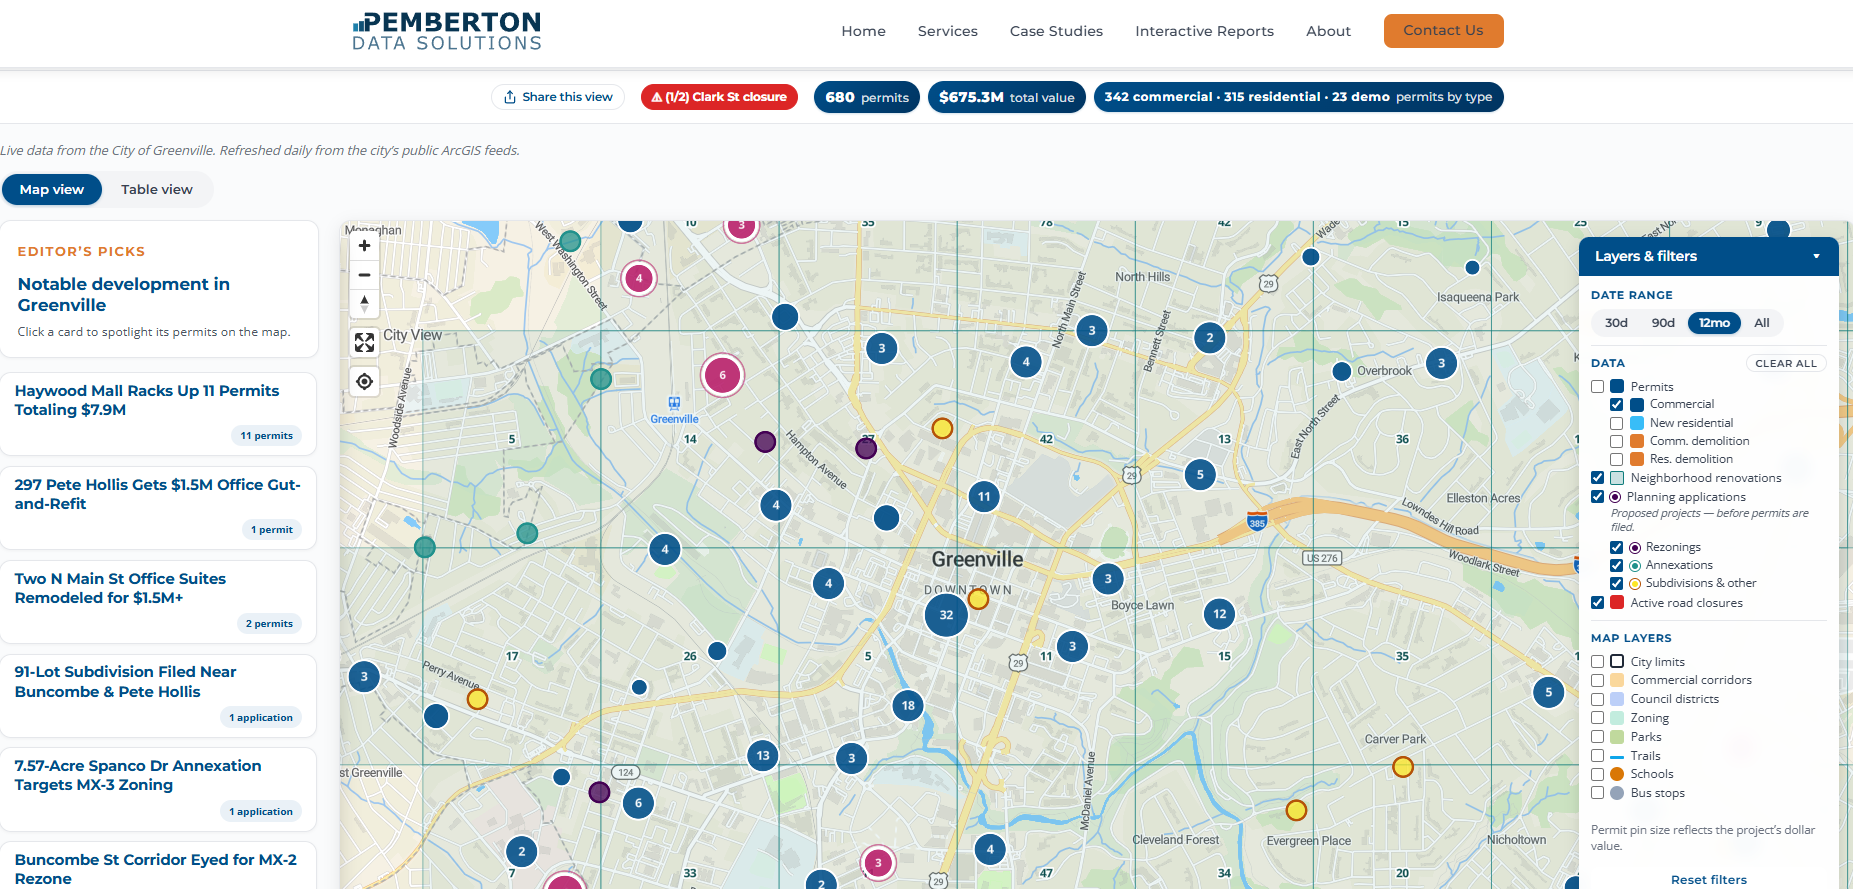
The Greenville Development Explorer is a map of every building permit, planning application, and active road closure in the City of Greenville, built from the city's public ArcGIS feeds. You can use it at pembertondata.com/map.
The city endpoint is documented and records are updated regularly. On paper this is about as clean a public dataset as you find in municipal government. Three things surfaced once we started working with it.
The Data Arrived in the Wrong Coordinate System
Pins on a web map need regular latitude and longitude. The city's feed hands back coordinates in a different system, the kind surveyors use for land records. You have to tell the server to convert them before it sends the response.
A one-line fix, once you know it
Coordinates arrive in a surveyor's projection, not latitude/longitude. Adding outSR=4326 to the API request converts them server-side before the response is sent. The problem is nothing anywhere tells you that's the fix.
Everything in the Raw Feed Is Shouting
Everything in the raw feed is shouting. 100 MAIN ST. SMITH CONSTRUCTION LLC. Permit types are internal city codes like BLDC (commercial building) and DEMR (residential demolition). Statuses are two-letter codes like IS and CL. None of it means anything to a person looking at a map.
We built a cleanup layer that title-cases the text properly, without flattening things that should stay uppercase like LLC or NW, and translates every code into a human label. It runs once inside the pipeline, and the clean version is what everything downstream reads, from the database to the chart labels on the map.
Before: raw from ArcGIS
BLDC · IS · 100 N MAIN ST · x: 1555231.4, y: 987412.8
After: what the map reads
Commercial Building · Issued · 100 N Main St · 34.852°N, 82.395°W
Once the codes were labels, the same cleanup layer became the hook for the privacy logic below. We could tell a residential permit from a commercial one without parsing anything.
We Chose Not to Republish Homeowner Data
This is the part that mattered most.
The permit data is public record. We're legally allowed to republish all of it, names and addresses included. Most permit viewers do exactly that. If you search around, you'll find tools that will show you which of your neighbors is renovating their kitchen and who their contractor is.
We made a deliberate choice not to do that.
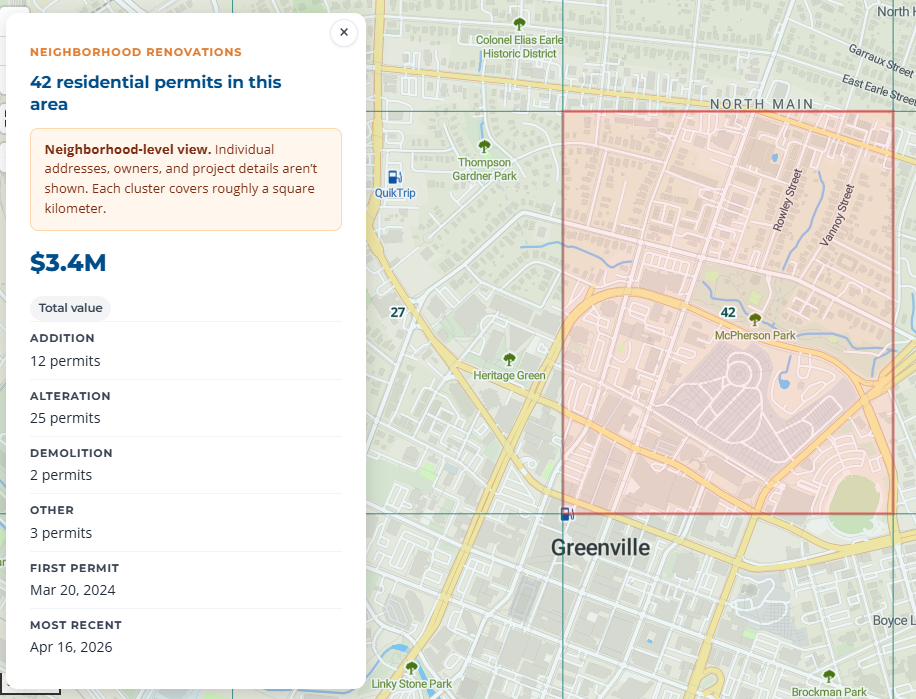
On our map, residential permits never show an individual address or an owner name. They're aggregated into grid cells roughly one square kilometer each, showing only totals: how many permits, what they were valued at, what categories they fell into. The exact location of any single renovation is not recoverable from what we publish.
Commercial permits show in full, because a commercial property and its owner are already part of everyday public life. New residential construction shows the location but strips the homeowner's name, because the project itself is visible from the street during construction.
Making this work required a classification layer inside the pipeline that separates residential from commercial permits and routes each class differently all the way through to the front end. The masked records never enter the web feed. There is no way for the browser to reveal them, because the data is never sent to the browser in the first place.
Two Triggers, Two Rhythms
Road closures come from a separate E911 feed and need to feel current. Someone driving across town shouldn't see a closure that cleared two hours ago. Permits don't change at that pace.
So the pipeline runs two triggers. A daily job pulls permits and planning data, writes everything to Azure SQL, and publishes the JSON the map reads from. An hourly job pulls road closures only, writes straight to blob storage, and skips the database entirely. The serverless database stays asleep between daily runs instead of waking up every hour for a feed that has nothing to do with it.
Daily
Permit + planning refresh
Hourly
Road closure refresh
Azure SQL
Permits database
Blob only
Closures, no DB wake
What It Looks Like When It Works
The map loads. Pins where the permits are. Aggregate cells where the renovations are. A road closure is either there or it isn't. None of the shape of the underlying data is visible to the person using the tool.